Analytics
The Analytics dashboard gives administrators real-time and historical visibility into how the team uses their virtual spaces — who is meeting, for how long, and how people collaborate.
Analytics is only visible to administrators.
Use WiLine 2gether Analytics
Know who is meeting, for how long, and how the team collaborates — organized into three tabs: Users, Meetings, and Insights.
- Right-size your spaces — compare seat count against active users to avoid paying for unused seats.
- Spot disengaged users — identify members with no recent meetings or low active days and follow up.
- Understand peak load — use peak concurrent data to decide if a space needs more capacity.
- Review collaboration health — track conversation length and frequency to see if teams are actually connecting.
- Audit attendance — cross-reference meeting history with absence records for accurate reporting.
To open Analytics:
- Open the 2gether Portal URL in your browser and log in.
- Locate the top-right feature area.
- Select WiLine 2gether Analytics.
- Use the Space dropdown at the top to select the space to analyze.
- Use the Time range filter to set the period: Today, Last 7 days, Last 30 days, or Last 90 days.
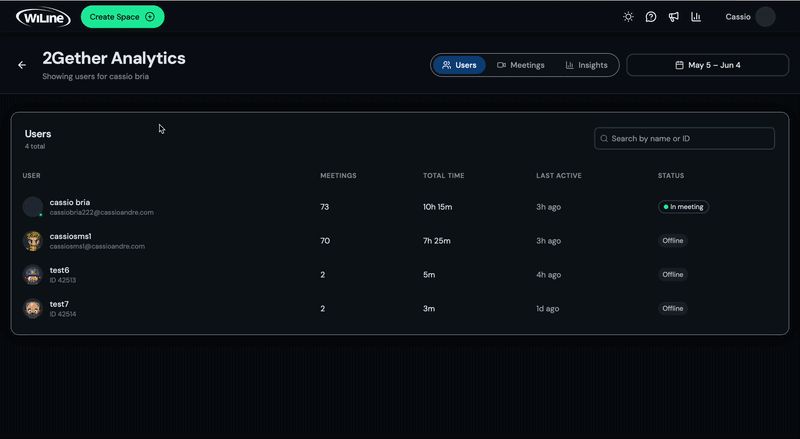
Users
The Users tab lists every user in the selected space.
| Column | Description |
|---|---|
| User | Display name and numeric user ID. |
| Meetings | Number of meetings attended in the selected period. |
| Total Time | Combined time spent in meetings. |
| Last Active | Time elapsed since the user was last seen in the space. |
| Status | Current presence — Online or Offline. |
Click any user to open their User Analytics panel.
User Analytics:
| Metric | Description |
|---|---|
| Meetings | Total meetings attended in the selected period. |
| Total Time | Combined meeting time. |
| Avg Duration | Average length per meeting. |
| Active Now | Whether the user is currently in a live session. |
Additional detail:
- Time tracked — time spent in each status (Available, Busy, Out of office, Do not disturb) with entry count, total duration, and percentage of the period.
- Top collaborators — colleagues who shared the most meetings with this user in the selected range.
- Absence history — PTO and Out of office entries with start and end timestamps.
- Meeting history — every session attended, showing room, realm, joined time, duration, participants present, peak count, and status.
Meetings
The Meetings tab shows aggregate data for all meetings in the selected space and period.
| Metric | Description |
|---|---|
| Total Meetings | Number of meetings held. |
| Total Time | Combined duration of all meetings. |
| Avg Duration | Average meeting length. |
| Unique Users | Distinct participants across all sessions. |
| Peak Concurrent | Maximum simultaneous active users at any point. |
| Active Now | Users currently in a live session. |
Below the metrics:
- Activity Timeline — a day-by-day chart of meeting count and total minutes per day.
- Meetings table — each session with room name, start time, duration, participant count (and peak), and status.
- Top Users — participants ranked by total meeting count for the period.
Insights
The Insights tab shows collaboration and engagement trends. Switch between Office and Members using the sub-tabs.
Office
Summary metrics:
| Metric | Description |
|---|---|
| Weekly Active Members | Members active at least once in the past week. |
| Number of User Conversations | Total conversations started in the selected period. |
| Median Conversation Length | Median duration across all conversations. |
| Used Wave/Ring | Percentage of members who used the Wave or Ring feature. |
Activity charts:
- Active members — daily count of members who were active.
- Peak concurrent users — highest number of users online simultaneously, per day.
- Active days by member — distribution of how many days each member was active during the period.
Collaboration charts:
- Hours of conversation — total conversation time per day.
- Median conversation length — daily median conversation duration.
- Conversation length — distribution of conversations by duration bucket: under 10 min, 11–30 min, 31–60 min, over 1 hr.
Members
The Members sub-tab shows a per-user breakdown over time.
| Column | Description |
|---|---|
| Name / ID | Member display name and numeric user ID. |
| Weekly columns | Hours spent in meetings for each week in the selected range. |
Additional charts show hours in office, hours available, active days, and Wave/Ring usage per member across the selected period.
Analytics data updates in real time — check regularly to keep spaces right-sized and teams engaged.